Snapshot debugging is the best way to debug the Business Central cloud production environment. It records AL codes that run on the server and after finishing the debugging all recorded snapshots are downloaded to your local project. You can debug any previously downloaded snapshots offline (Without connecting to the BC cloud server).
Required user permissions for snapshot debugging
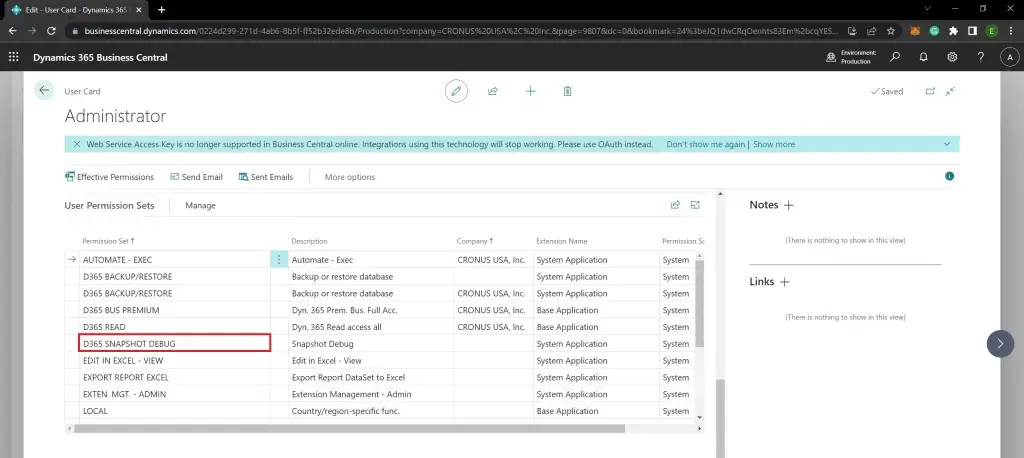
The user must be part of the D365 Snapshot Debug permission set when initializing the debugging session with the cloud server.
How to debug AL code using Snapshot debugging
Follow the below steps about debugging an error in the BC cloud production environment using a snapshot debugger.
- Open the AL project folder by Visual Studio Code.
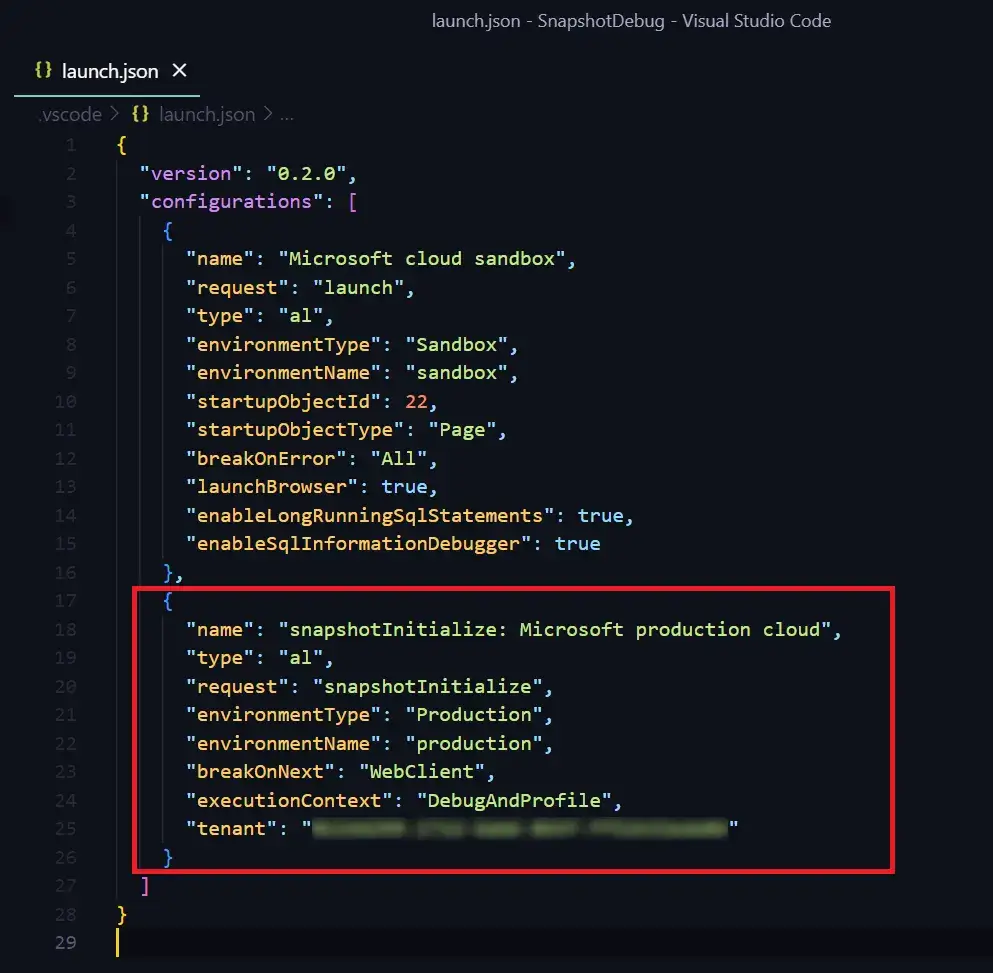
- Open launch.json and add the below configuration setting related to the snapshot debugging and change the tenant id:
Here is the example:{ "name": "snapshotInitialize: Microsoft production cloud", "type": "al", "request": "snapshotInitialize", "environmentType": "Production", "environmentName": "production", "breakOnNext": "WebClient", "executionContext": "DebugAndProfile", "tenant": "Specify the tenant id" }
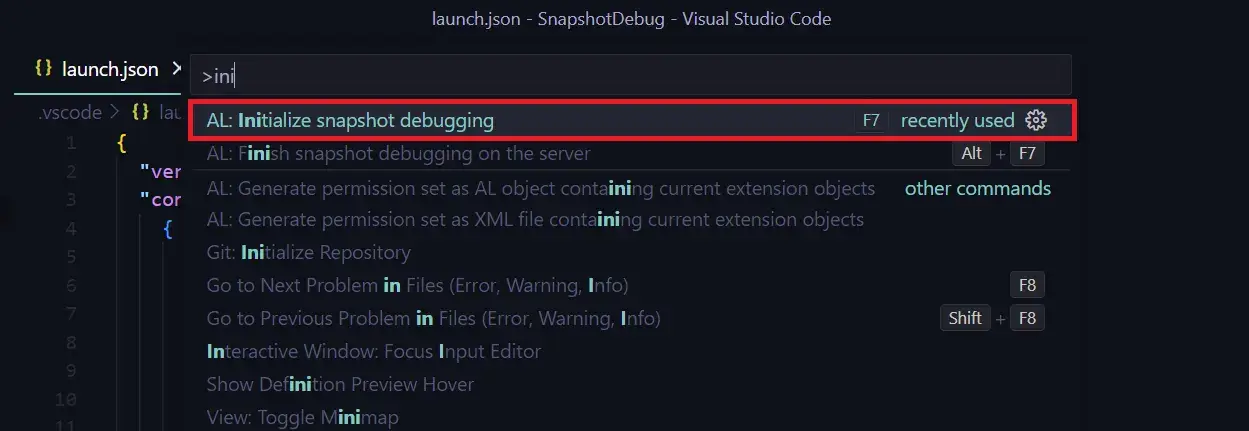
- Go to the command palette (Ctrl+Shift+P) and type “AL: Initialize snapshot debugging” and Enter (F7 is the shortcut key) to start the debugging session:

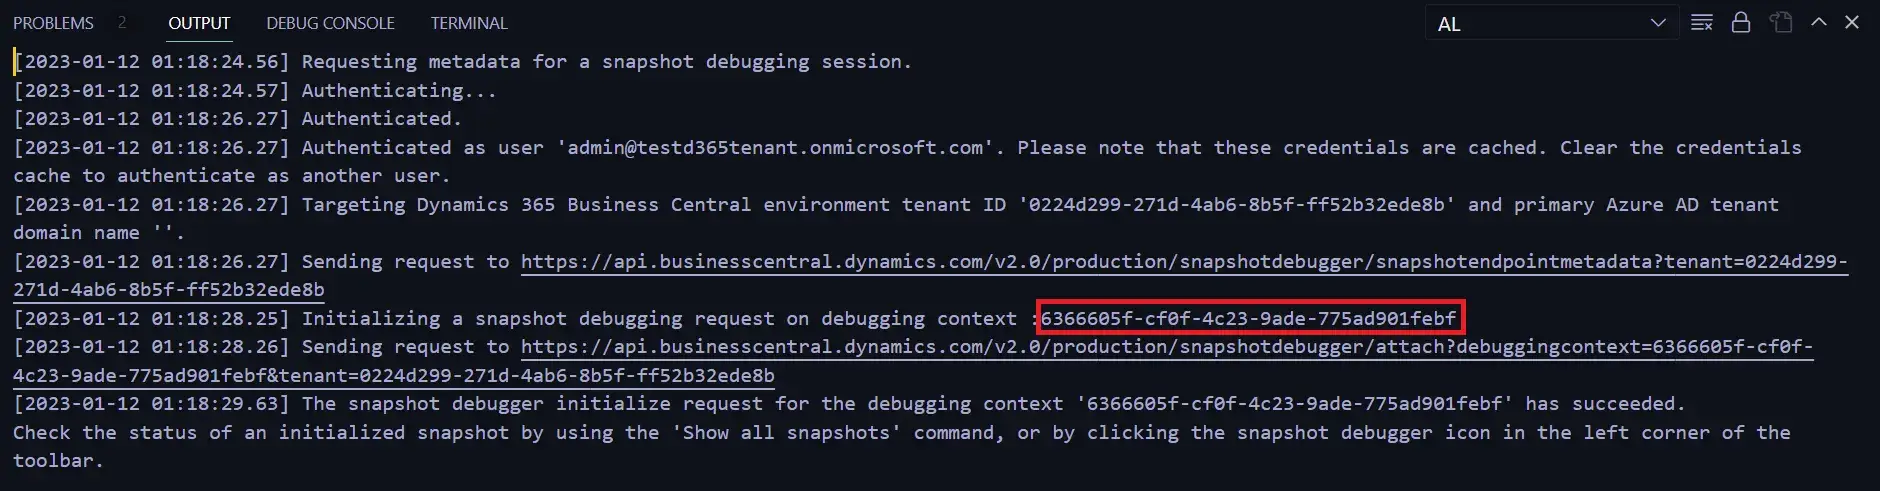
Now It starts a new snapshot debugging session and the session id will show in the output console:
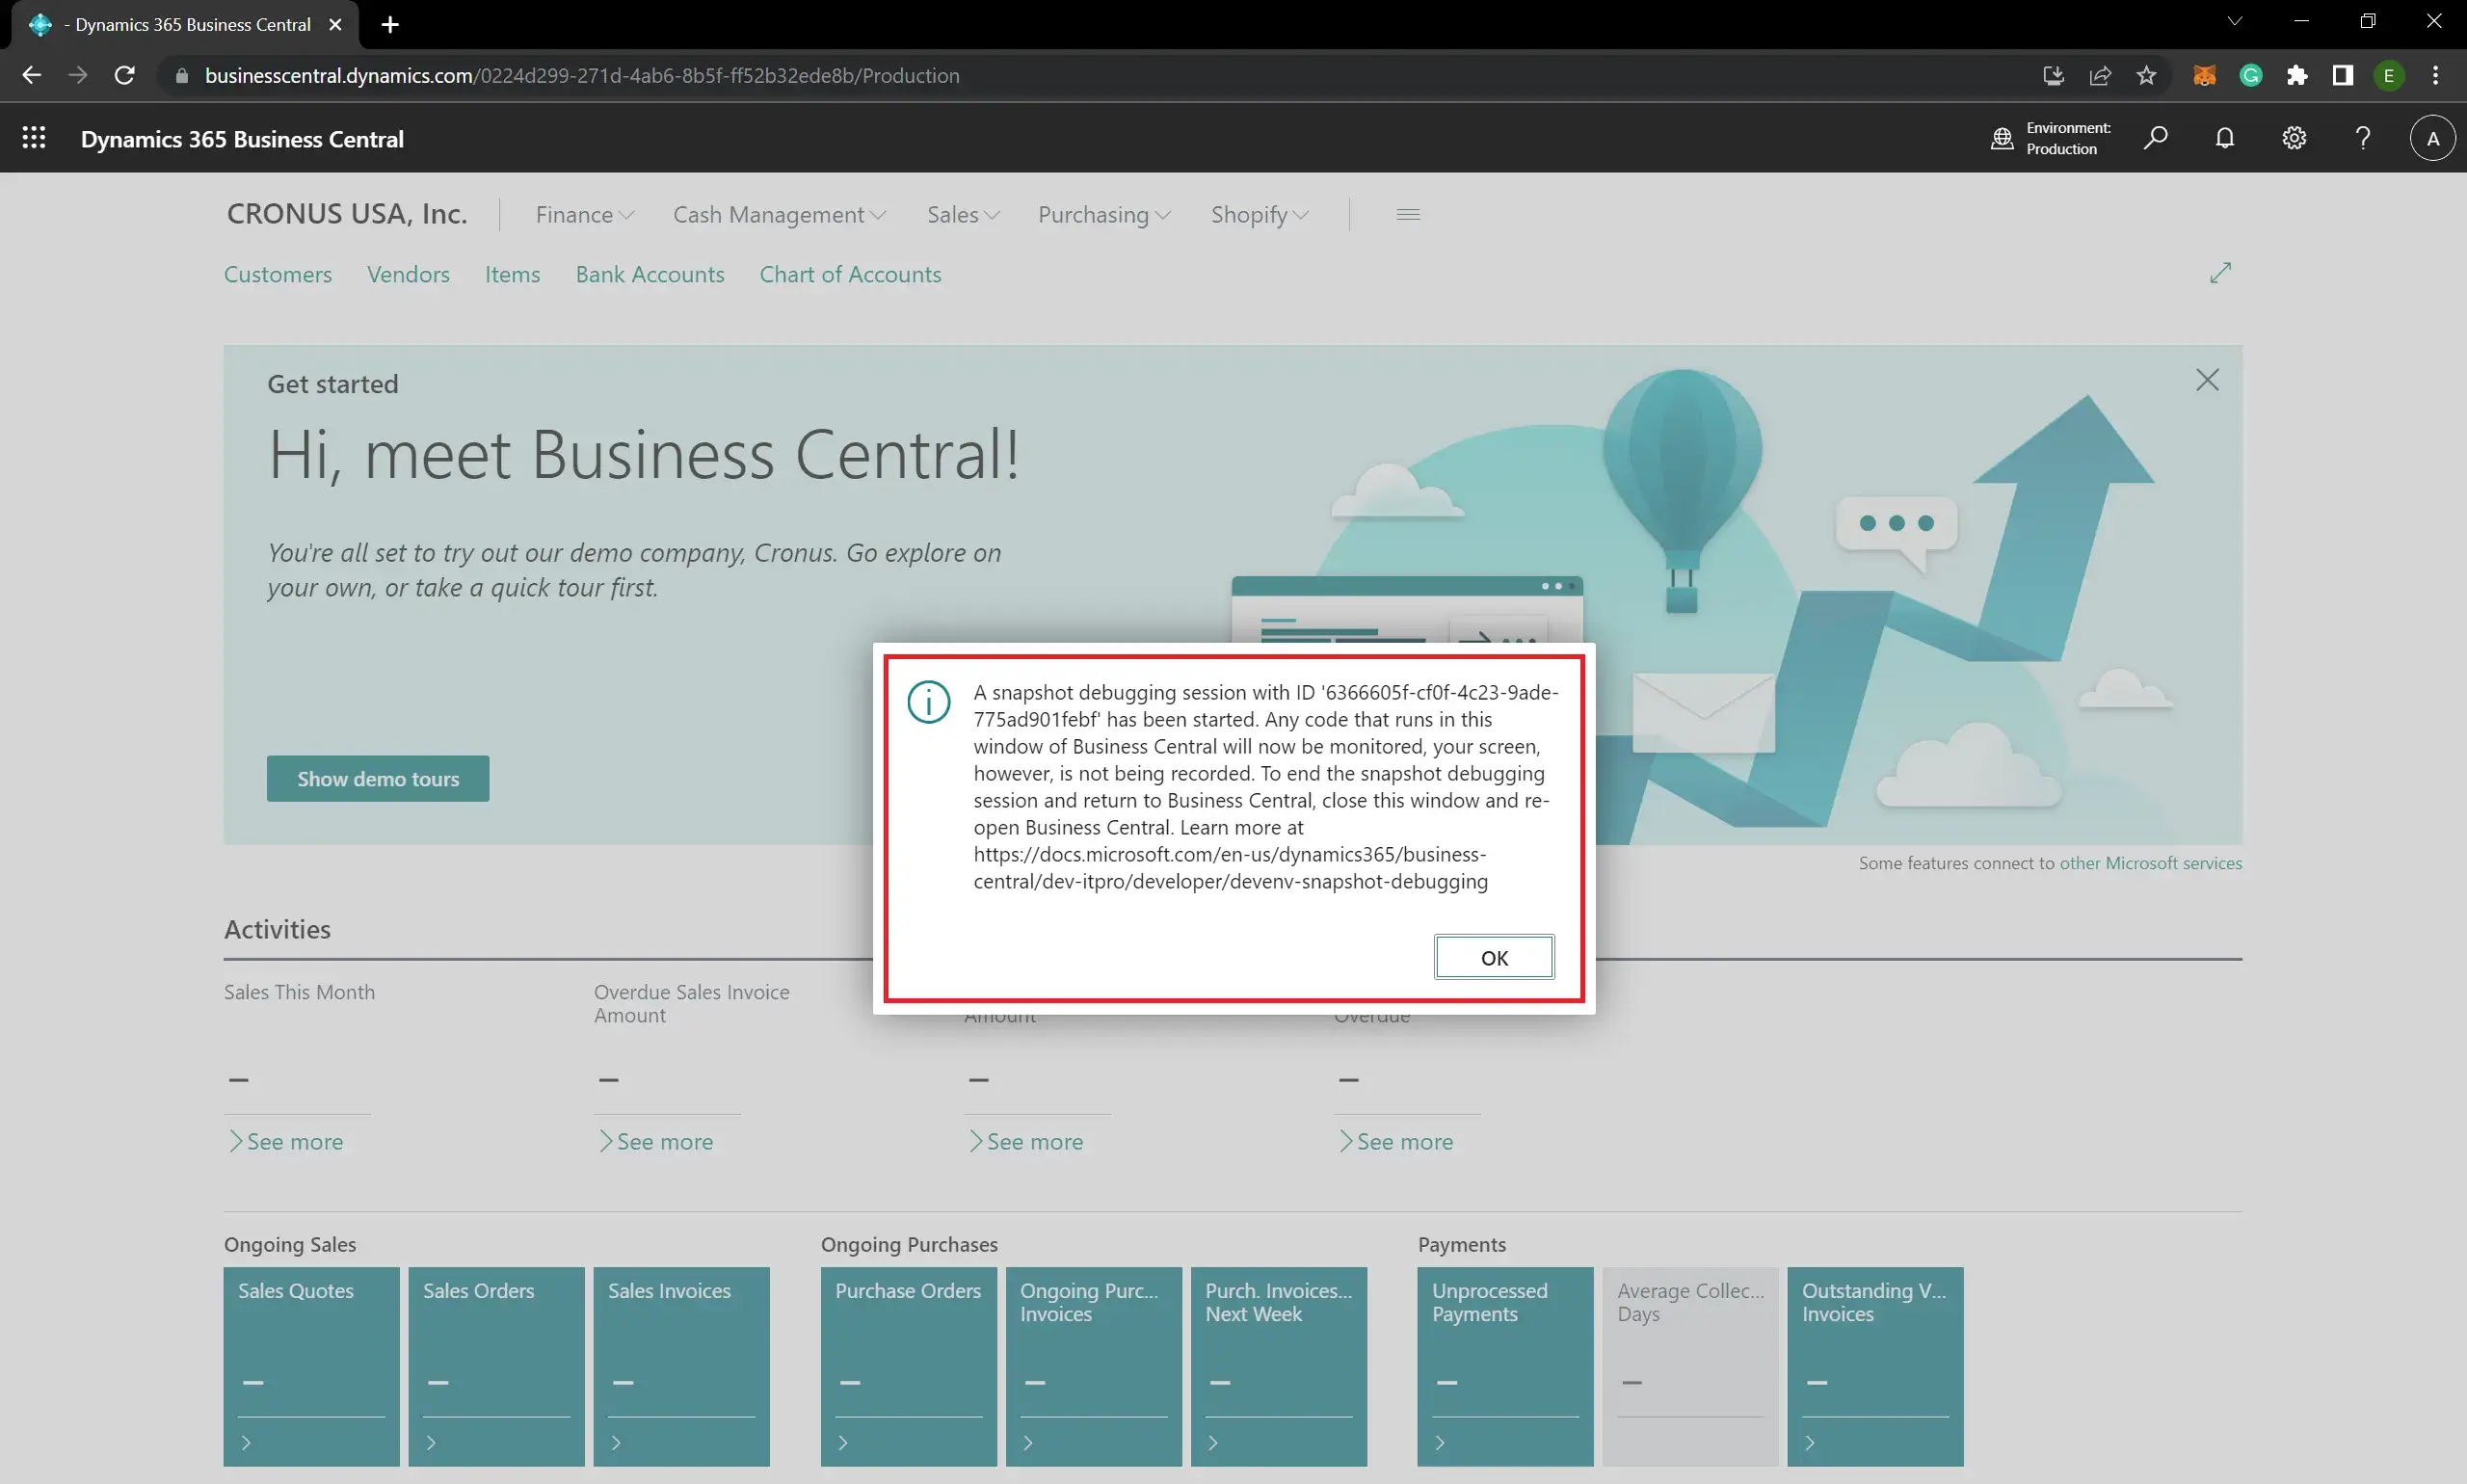
- Reload the Business Central in the browser and it will notify details of the snapshot debugger session as per the below:

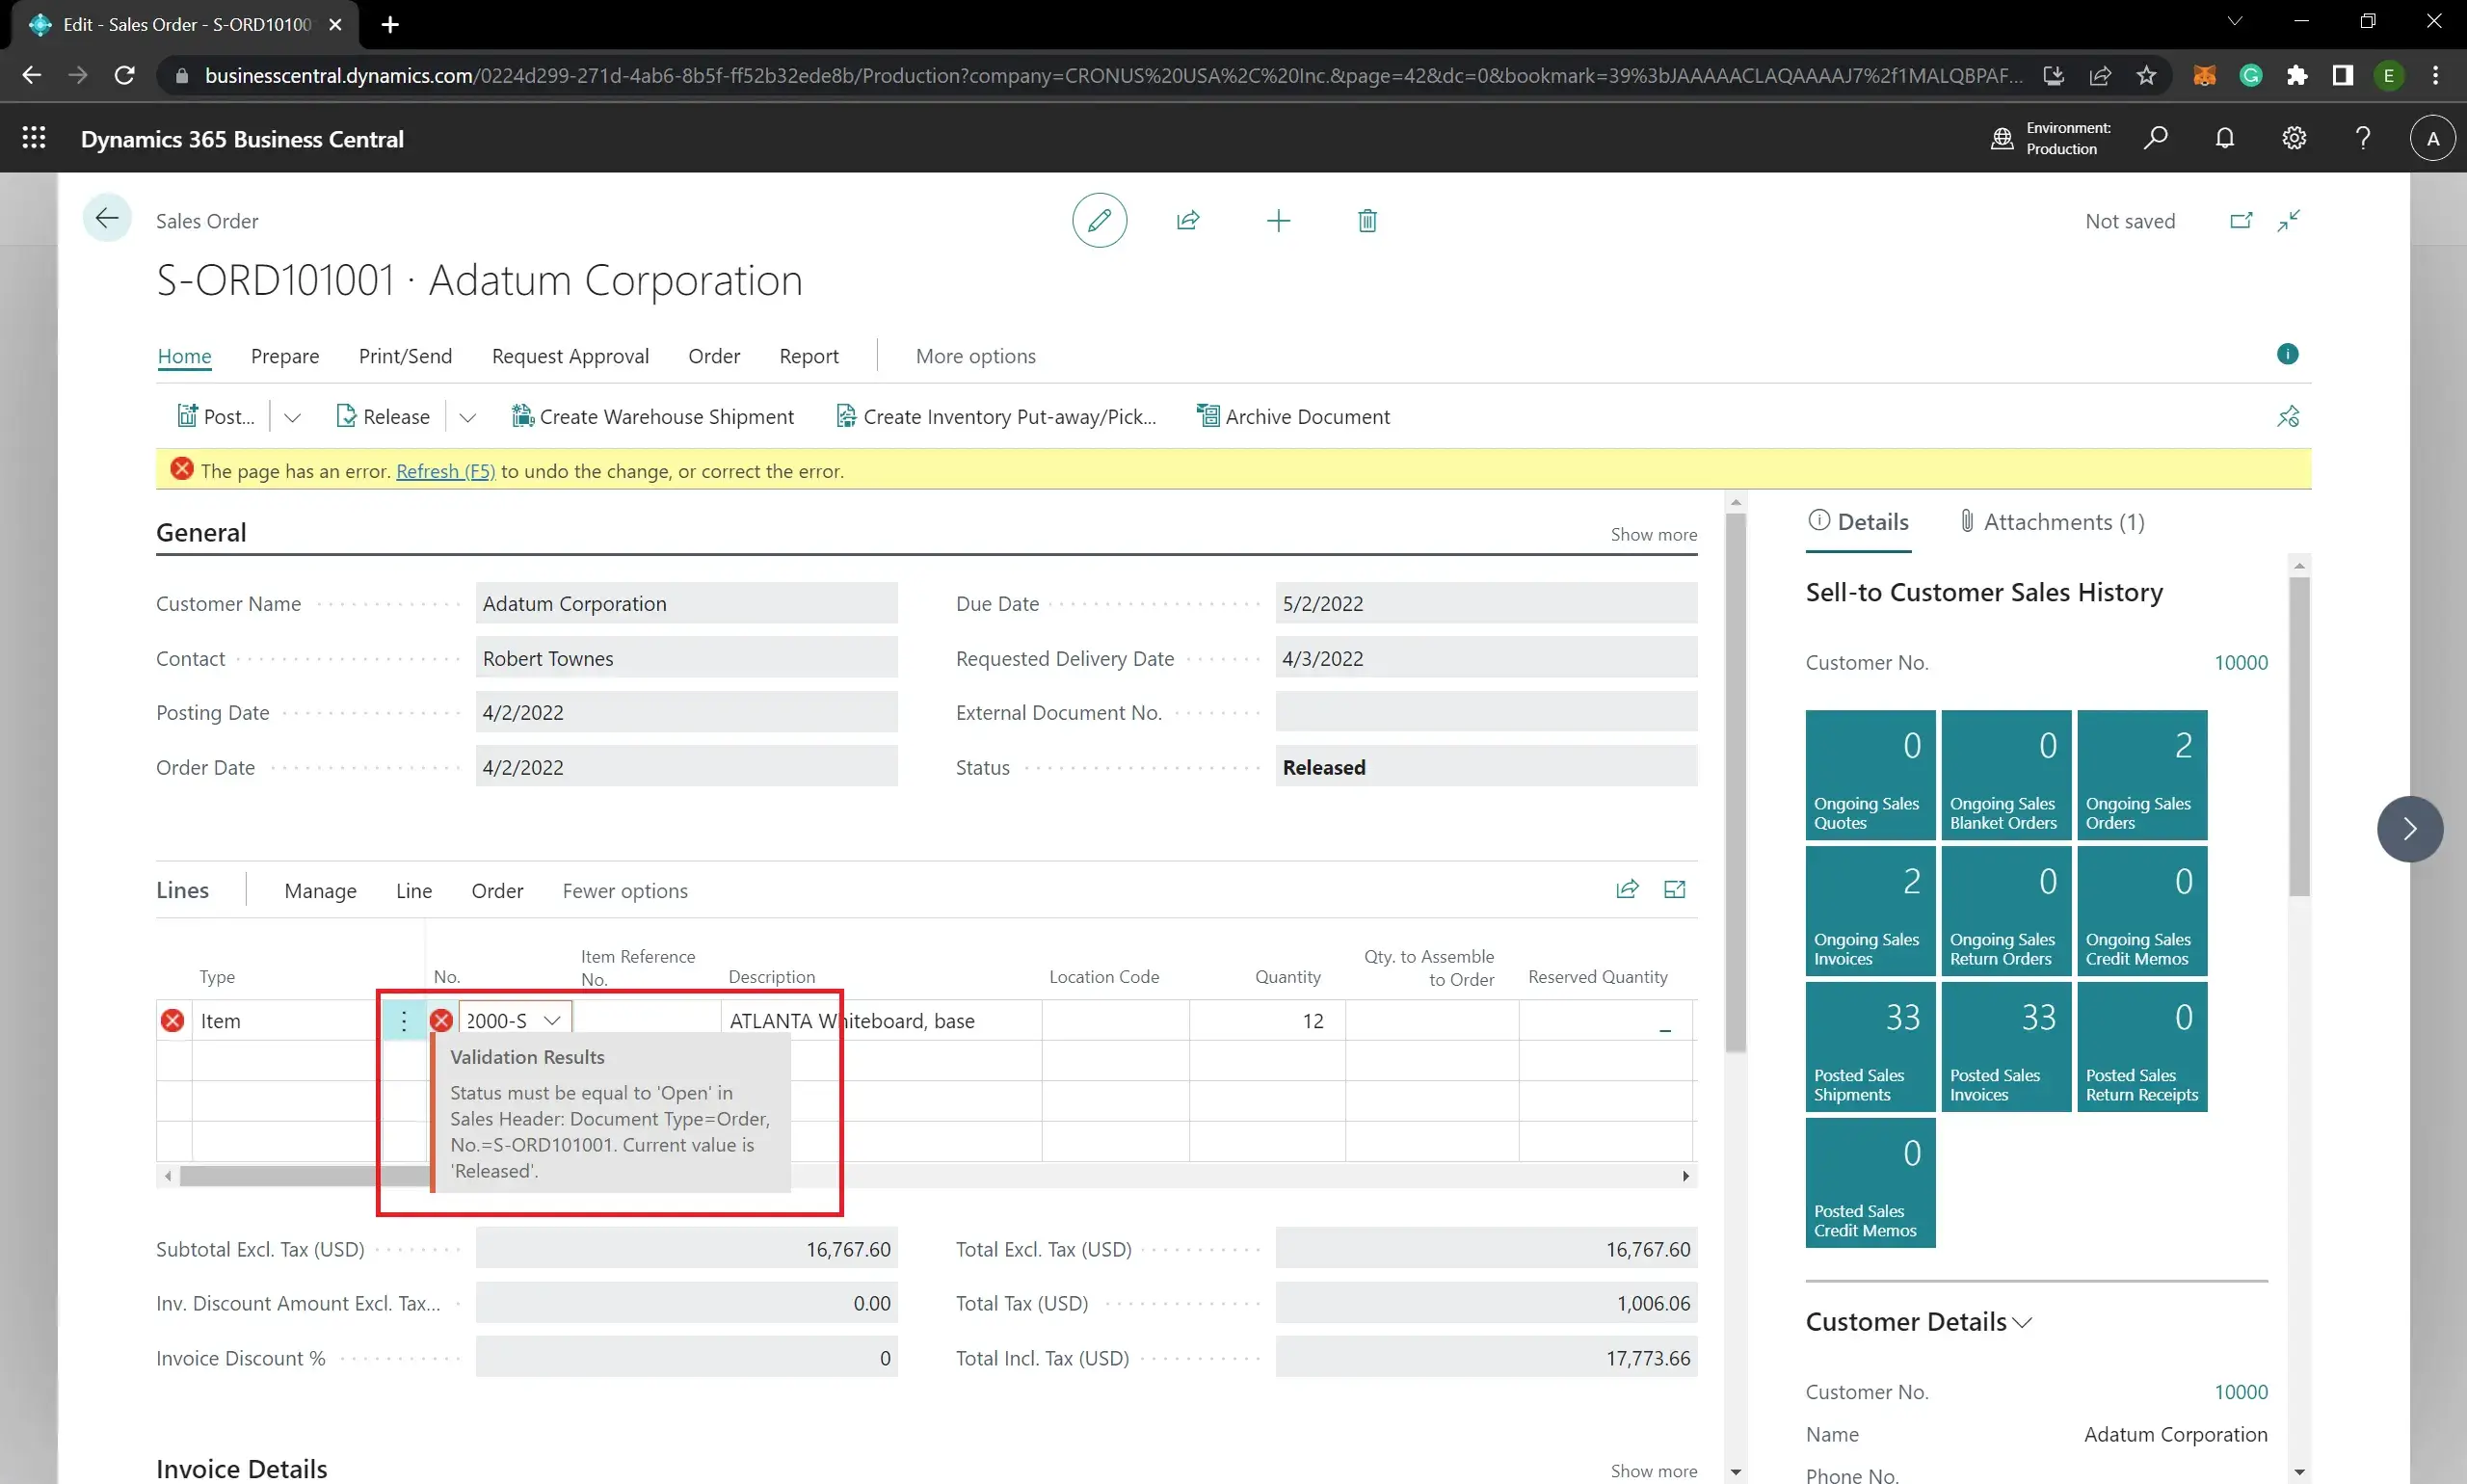
- Now you can test any error or process and the snapshot debugger is recording every AL code relevant to any process that you are doing the Business Central. As an example I test the validation error in the sales order:
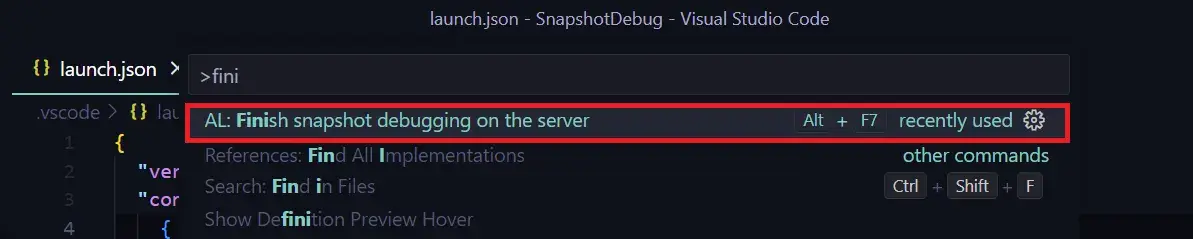
- After testing, go to the command palette (Ctrl+Shift+P) and type “AL: Finish snapshot debugging on the server” and Enter (Alt+F7 is the shortcut key):

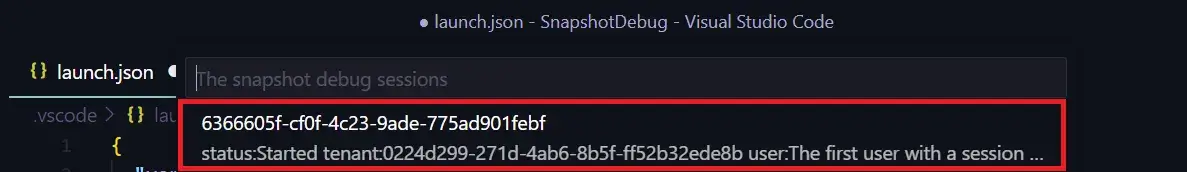
- Select the relevant session to finish:

Now recorded snapshot file with AL codes will be downloaded as a .zip file named session id to the snapshot folder. - Finally, click the snapshot debug session list Icon (Shift+F7) in Visual Studio Code and select the relevant session ID to debug the AL code:

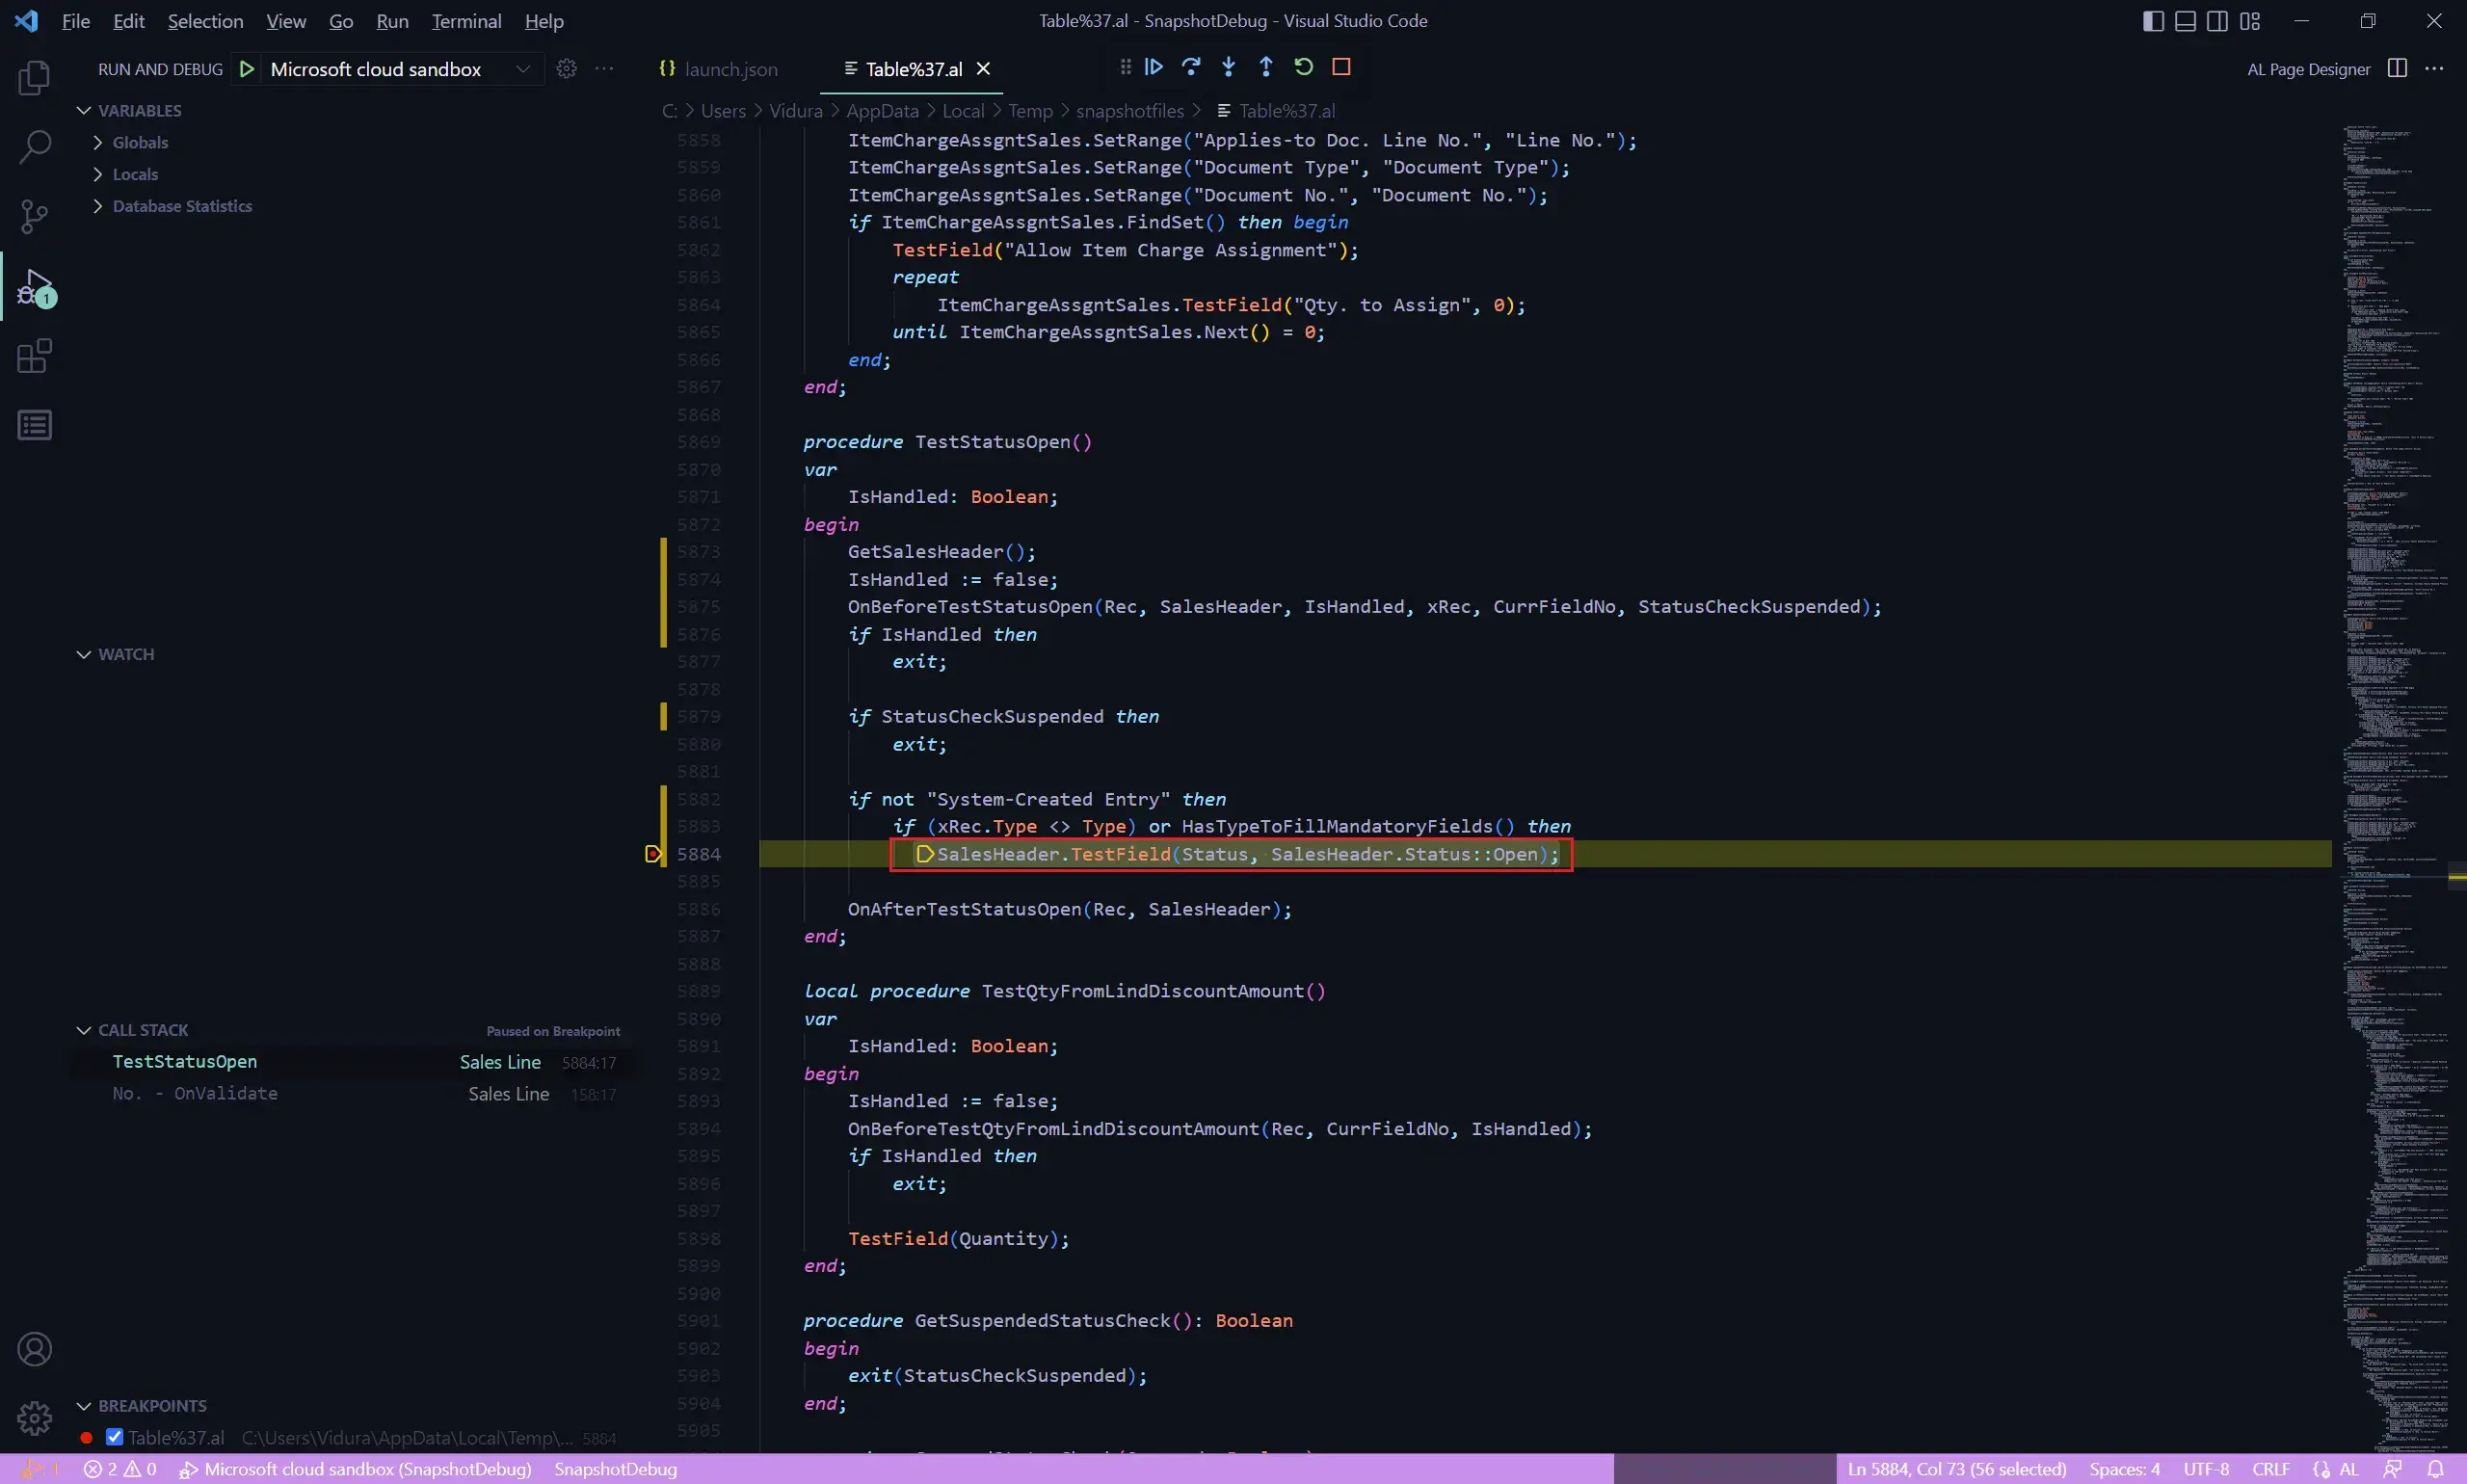
Here is the break point:
You can debug any downloaded snapshots as in the previous step without connecting to the BC cloud server. Also, you generate a profile with recorded AL triggers during the session by “AL: Generate profile file” command in the command palette.
Visit the previous guide about the function for split text with maximum characters without damaging words – AL / C/AL.
Vidura Dananjaya
Senior Solutions Architect - Microsoft Dynamics Navision / Microsoft Dynamics 365 Business Central and freelance developer. (The admin of NAVUSER)